The way consumers celebrate Valentine’s Day has changed.
This video explains how.
Did you know that Valentine’s Day sales reached an all-time high in 2016 at $19.7 Billion, according to the National Retail Federation.
Fortune and MarketWatch report that this year, sales for the holiday are projected to dip down to $18.2 Billion.
But nonetheless, Valentine’s Day continues to be one of the year’s most popular holidays – at least when it comes to consumer spending.
Marketers take note, the way consumers are celebrating Valentine’s Day has changed and the stats might actually surprise you.
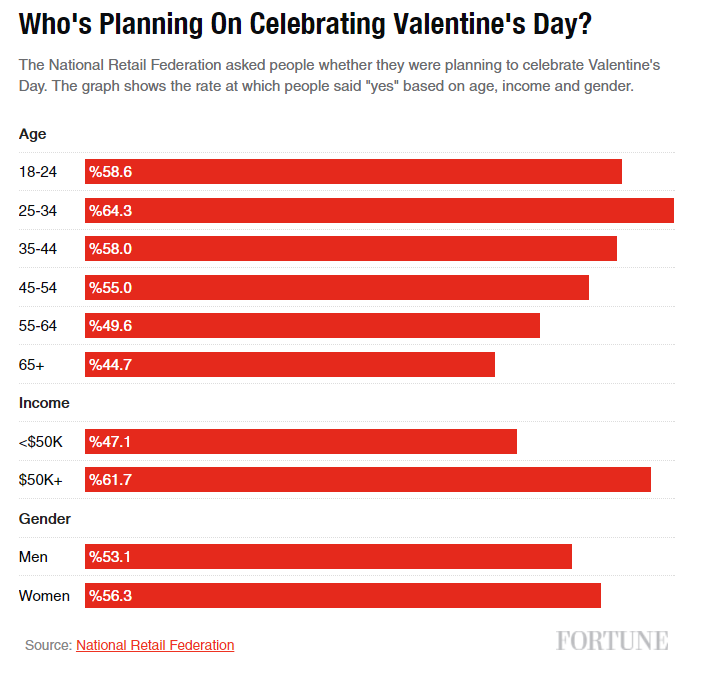
1. 54.8% of Americans Celebrate Valentine’s Day
In fact, people of all ages celebrate Saint Valentine’s Day.

2. Valentine’s Day Consumer Spending is Second Only to Christmas
Spending lots of money on Valentine’s Day is pretty normal. On average, people spend $512.03 for the special day.

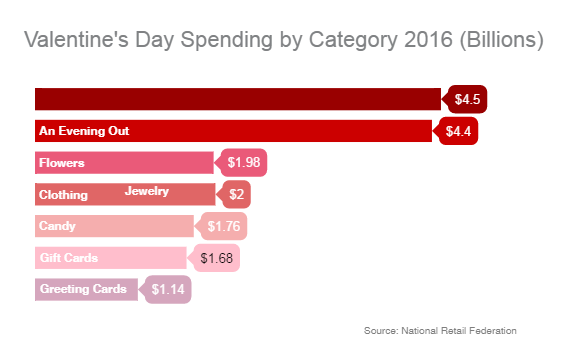
Considering what people are buying, the numbers add up…
3. Jewelry is the biggest consumer spending category, followed by Experiences

4. $681 Million total Valentine’s Day gifts are spent on pets

Just a few of our very own doggy friends at ClearPier.
That’s right. Consumers love their pets and Valentine’s Day is just another excuse to dote on our furry friends. In fact, 19% of all Valentine’s Day gifts go to pets, averaging out at $26 per shopper.
5. Singles, couples, men and women all participate – but men on average spend TWICE as much
No a days, it would be a mistake for marketers to focus on only couples. Many single people now also celebrate Valentine’s Day, while others simply buy presents for friends.
In fact, Bing has reported that when people search “Valentine’s Day Gifts For…” 22% of people fill the rest of that sentence in with “husband,” 20% finish it with “friend,” and 17% type in “boyfriend.”
And although things have changed, some traditional gender norms seem to persist as men typically spend on average twice as much as women for Valentine’s Day. A single man may spend on average $71 for the holiday, while a single woman may only spend $40, although people in a relationship typically spend more.
6. More people are shopping online, and Mobile drives that growth
From 2015 to 2016, mobile searches for Valentine’s Day rose from 40% to 48% according to Bing. However, there is still a 50-50 split between desktop and mobile shoppers.
7. 50% of proposals actually happen around Valentine’s Day which contributes to keep jewelry a popular gift item
That’s good news for brands advertising big ticket items like engagement rings, ear rings, necklaces, and more.

8. But Experiences based gifts or evenings out are also popular – great news for local search.
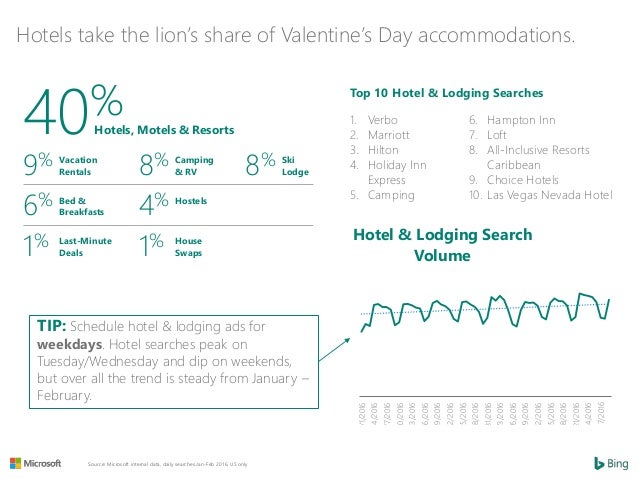
39% of individuals prefer gifts like tickets to a concert, a dinner out, or a day at the spa or a relaxing stay at a ritzy hotel to material gifts.

And with 34% of consumers planning to eat out on Valentine’s Day, restaurant ads actually peak the day before the holiday. And the reason for that may simply be that Valentine’s Day gifting usually includes less planning and more impulse purchases instead.
9. These were the most popular search terms in 2016 on Bing for Valentine’s Day (Desktop):
- Etsy
- Flowers
- Olive Garden
- Valentine’s Day
- Victoria Secret
- Edible Arrangements
- Love
- Kay Jewelers
- Hearts
- Eddie Bauer
10. These were the most popular search terms in 2016 on Bing for Valentine’s Day (Mobile):
- Jewelry
- Valentine’s Day
- Engagement rings
- Earrings
- Love
- Gift card
- Pandora charms
- Etsy
- Necklace
- Online grocery
11. Valentine’s Day results in 7.6% increase of usage for matchmaking apps like Tinder
In fact, according to Tinder, last Valentine’s Day the app saw a 7.6% usage increase and a 6% match increase (U.S.). Messaging also increases by 5.2% (U.S.) on Tinder around Valentine’s Day.

So it’s a happy Valentine’s Day for many, indeed.
You can get more Valentine’s Day marketing insights from Bing in their Search Bing for Love presentation.
Want to learn more? Connect with our team at sales@clearpier.com